
Guides
SBA 7(a) loan default rates: what predicts a charge-off
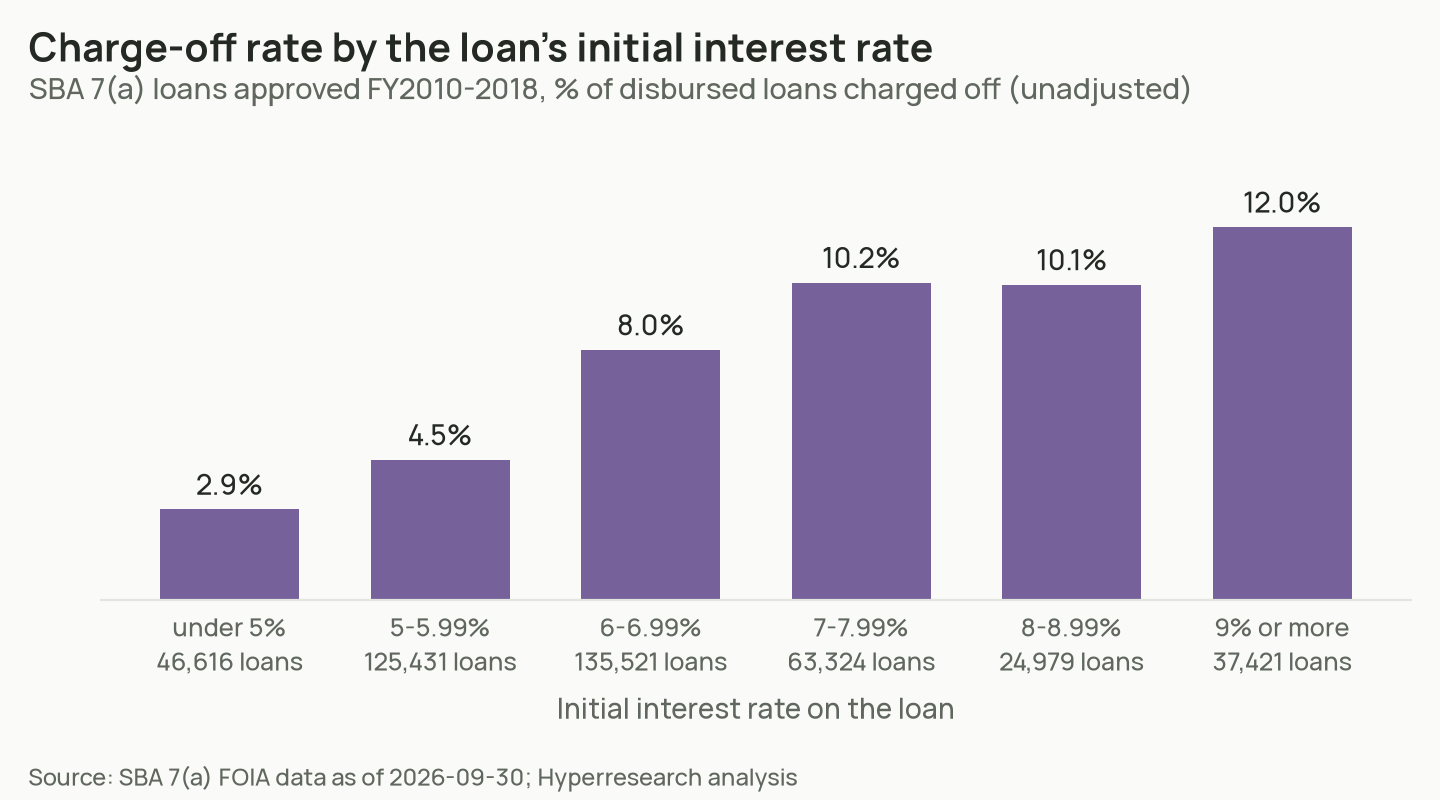
Of the 433,292 SBA 7(a) loans approved in fiscal years 2010 through 2018 and disbursed, 7.2% had been charged off by September 30, 2026. The strongest warning sign in SBA’s loan file is the interest rate the lender charged. Loans priced under 5% were charged off at 2.9%, and loans at 9% or more at 12.0%. Holding loan size, industry, year and a dozen other features fixed, each extra percentage point of rate goes with 29% higher odds of charge-off, and a variable rate with 58% higher odds. Franchise loans carry 24% higher odds than other loans after the same controls. SBA Express loans do not fail more than comparable Preferred Lender loans. Non-bank lenders charge off almost twice the share that banks do, and the gap disappears only when the loan terms those lenders set are held fixed. Every figure on this page is our own calculation from SBA’s public loan-level file.
Main results
- Overall rate. 31,347 of 433,292 disbursed loans approved FY2010-2018 were charged off: 7.2% (95% interval 7.2% to 7.3%). Charged-off dollars came to 3.1% of the amount approved, $4.89 billion of $159.9 billion.
- Interest rate. The lender’s own price sorts risk better than any other field in the file. It reflects what the lender knew about the borrower; it does not show that the rate causes failure.
- Franchises. 9.0% of franchise loans were charged off against 7.1% of other loans, and the gap holds after controls (odds ratio 1.24).
- SBA Express. A first model suggested Express loans fail more. That result came from Express loans’ fixed 50% guarantee and does not survive a check.
- Non-bank lenders. 13.5% charged off against 7.0% at banks. Their loans are riskier than bank loans to similar borrowers, and they are priced and structured that way.
- The late 2010s. Measured over the same five-year window, the charge-off rate rose from 3.1% for loans approved in FY2013 to 4.7% for FY2018.
- Loan term. The loan-term field in the public file looks rewritten after a loan goes bad. It should not be used to predict default.
The interest rate is the strongest signal
Lenders charge riskier borrowers more, and the file shows they price that risk with some accuracy. The raw charge-off rate rises with the initial interest rate on the loan:
| Initial interest rate | Loans | Charged off | Rate | 95% interval |
|---|---|---|---|---|
| Under 5% | 46,616 | 1,358 | 2.9% | 2.8% to 3.1% |
| 5% to 5.99% | 125,431 | 5,647 | 4.5% | 4.4% to 4.6% |
| 6% to 6.99% | 135,521 | 10,884 | 8.0% | 7.9% to 8.2% |
| 7% to 7.99% | 63,324 | 6,450 | 10.2% | 10.0% to 10.4% |
| 8% to 8.99% | 24,979 | 2,529 | 10.1% | 9.8% to 10.5% |
| 9% or more | 37,421 | 4,479 | 12.0% | 11.6% to 12.3% |
Market rates moved during these years, so we also compared each loan with the median rate of its own approval year. Loans priced a point or more below that year’s median were charged off at 2.75%. Loans priced three or more points above it were charged off at 11.9%. The pattern holds inside each year.
In the regression, which also holds size, industry, year, region and the other features fixed, each extra point of initial rate goes with odds 1.29 times as high (95% interval 1.25 to 1.34). Variable-rate loans have odds 1.58 times those of fixed-rate loans (1.41 to 1.76). Both results hold in every version of the model we ran, including earlier and later cohorts and a version limited to loans that have ended.
What else goes with a charge-off
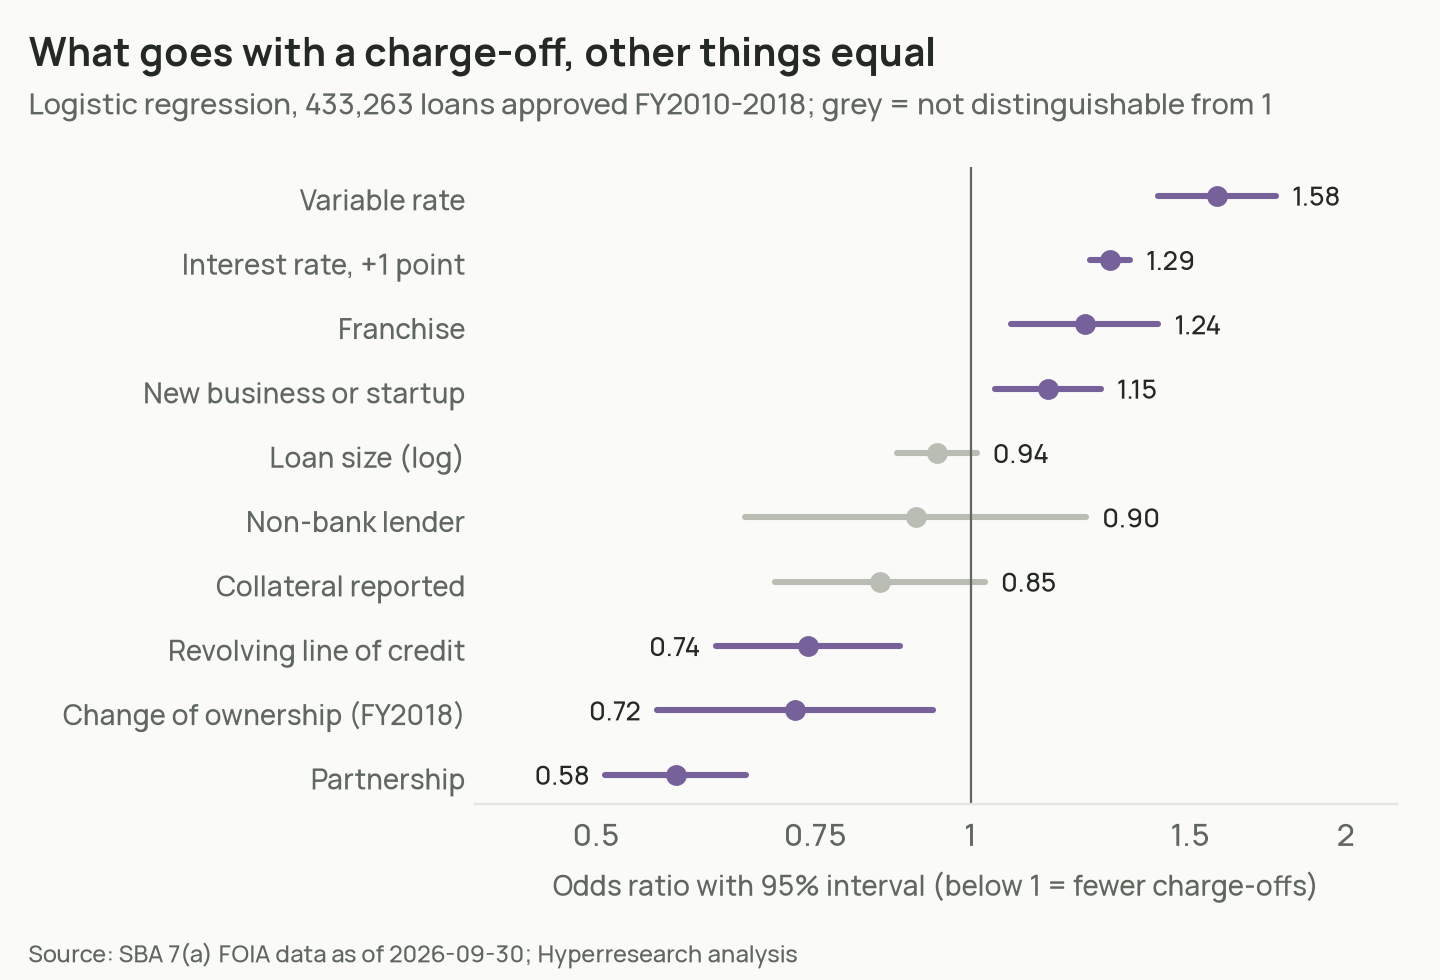
After controls, these features go with more charge-offs:
- Franchise: odds ratio 1.24 (1.08 to 1.42). Across model versions it ranges from 1.15 to 1.37.
- New business or startup (under about two years old): 1.15 (1.05 to 1.27). The raw rate is 8.5%, against 6.6% for businesses two or more years old.
- Guaranteed part sold on the secondary market: 1.28 (1.03 to 1.58).
These go with fewer:
- Revolving lines of credit: 0.74 (0.62 to 0.88), but only once the rate is controlled for.
- Change of ownership, meaning the loan financed the purchase of a going business: 0.72 (0.56 to 0.93). The field exists only from FY2018, so this rests on 3,938 loans.
- Partnerships compared with corporations: 0.58 (0.51 to 0.66).
- Western states compared with the South: 0.71 (0.64 to 0.79).
Loan size matters a great deal in the raw data, from 9.2% charged off at $25,000 or less to 3.6% above $2 million. After controls it adds little (0.94 per log unit, 0.87 to 1.01). Most of the size effect runs through price and loan type. Health care loans had odds 0.60 times those of retail loans.
The model sorts risk only modestly. Its AUC is 0.67, where 0.5 is a coin flip and 1.0 is perfect. The file has no credit score, cash flow or owner equity, which lenders use and the public data leaves out.
SBA Express loans do not fail more once the guarantee is counted
Our first model gave SBA Express loans an odds ratio of 1.46 against Preferred Lender (PLP) loans, which would mean Express loans fail more. That result does not hold up. SBA guarantees 50% of an Express loan and 75% to 85% of most other 7(a) loans. In the file, 94.7% of Express loans carry exactly a 50% guarantee, against 0.5% of PLP loans. With guarantee share in the model, the Express term and the guarantee term measure nearly the same thing and offset each other.
| Comparison, Express vs PLP | Odds ratio | 95% interval |
|---|---|---|
| Express term alone, guarantee share in the model | 1.46 | 1.19 to 1.79 |
| Model without guarantee share | 0.92 | 0.73 to 1.15 |
| Express at 50% vs PLP at 75%, from the full model | 0.92 | 0.74 to 1.15 |
| Express at 50% vs PLP at 85%, from the full model | 0.77 | 0.60 to 0.99 |
| Loans up to $350,000, without guarantee share | 1.02 | 0.85 to 1.22 |
| FY2014-2018 only, without guarantee share | 0.88 | 0.66 to 1.19 |
The raw numbers point the same way. Among loans of $50,000 to $150,000, Express loans were charged off at 6.0% (57,953 loans) and PLP loans at 12.1% (21,775 loans). Express loans charged off at about the same rate as PLP loans of the same size and price, or a lower one. Express status and guarantee share cannot be separated in this file, so neither odds ratio means much on its own.
Non-bank lenders and what explains the gap
Non-bank lenders, the 199 lender locations in the cohort with no FDIC or NCUA number, are mostly SBA-licensed lending companies and mission lenders. They charged off 13.5% of 16,619 loans. Banks charged off 7.0% of 402,152 loans, and credit unions 5.9% of 14,521.
The gap is not explained by the kind of business. With year, industry, region, business type and age, loan size, franchise and collateral held fixed, non-bank loans still have 1.81 times the odds of charge-off. It closes only when we add the terms the lender sets:
| Controls in the model | Non-bank vs bank odds ratio | 95% interval |
|---|---|---|
| None | 2.07 | 1.39 to 3.09 |
| Borrower and loan features | 1.81 | 1.55 to 2.12 |
| Plus processing method and revolving line | 1.53 | 1.23 to 1.90 |
| Plus guaranteed part sold | 1.16 | 0.88 to 1.52 |
| Plus guarantee share | 1.01 | 0.73 to 1.42 |
| Plus interest rate terms (full model) | 0.90 | 0.66 to 1.24 |
Non-bank lenders sold the guaranteed part of 82.6% of their loans, against 23.9% for banks. Their average guarantee was 81.6% (banks 64.3%) and their average initial rate 7.08% (banks 6.38%). Dropping only the rate terms or only guarantee share from the full model still leaves no gap (1.01 and 1.06). Our reading is that non-bank lenders make riskier loans than banks make to similar borrowers, and price and structure them for that risk. On loans with the same terms, they do no worse than banks.
Charge-offs rose through the late 2010s
Older loans have had more time to fail, so the share charged off to date is not a fair way to compare years. Counting only charge-offs within five years of approval puts every year on the same footing:
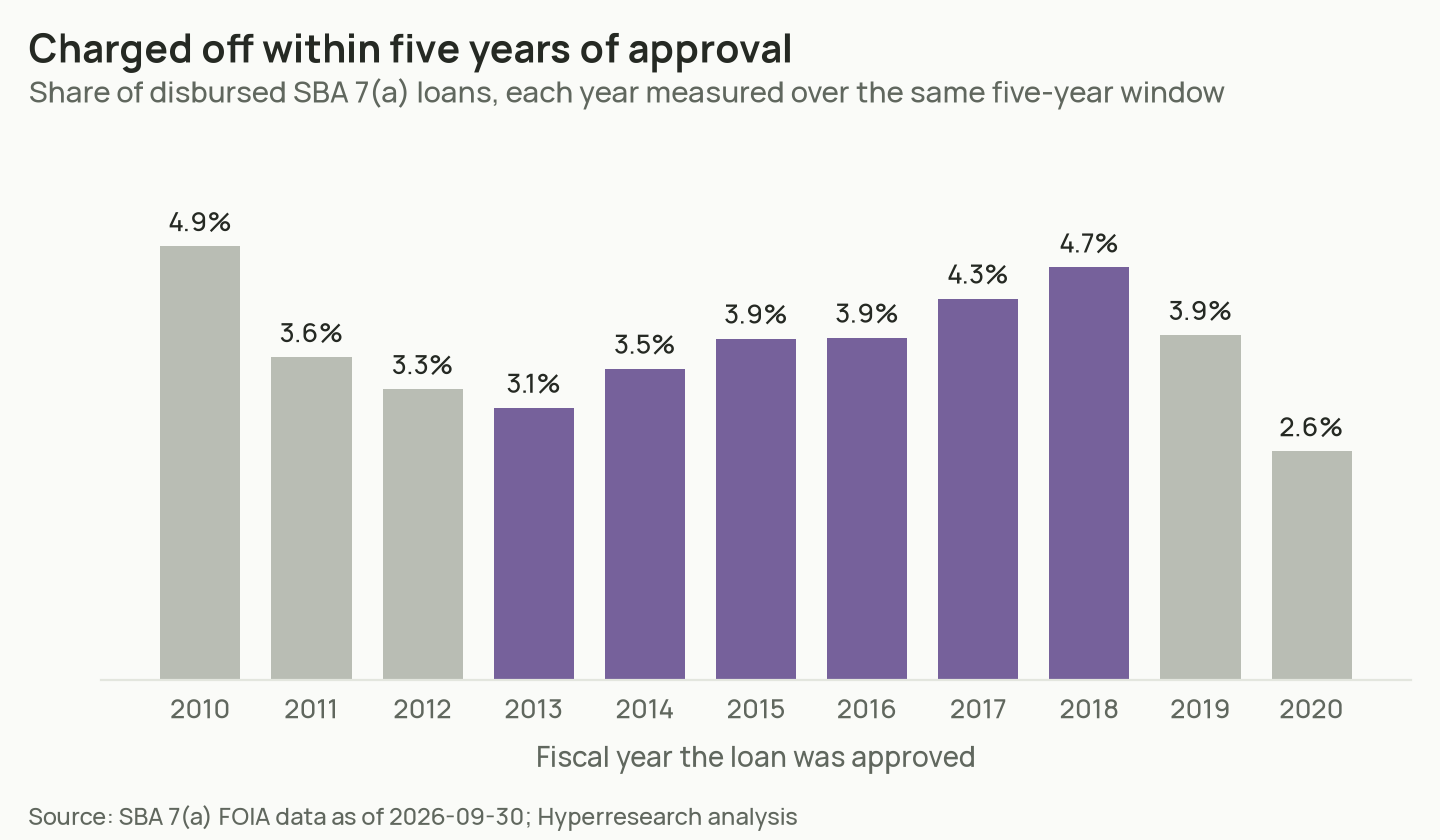
On that basis the rate fell from 4.9% for FY2010 loans to 3.1% for FY2013 loans (40,416 loans), then rose to 4.7% for FY2018 loans (54,195 loans). FY2019 and FY2020 loans look better, 3.9% and 2.6%, but their first five years overlap COVID-era payment relief for 7(a) borrowers, which likely pushed some failures later.
The 2010s are mild next to the decade before. Of loans approved in FY2000-2009, 23.7% were charged off (144,250 of 608,057), with FY2007 the worst year at 36.7%. Charge-offs also come late. For FY2000-2009 loans the median time from approval to charge-off was 4.2 years, and only 62% of eventual charge-offs had happened by year five.
The loan-term field changes after a loan goes bad
SBA’s file has a TermInMonths field, and it looks like an obvious predictor. Do not use it as one. A term set at approval should be a round number, such as 84, 120 or 300 months. That holds for 84.6% of paid-in-full loans but only 9.2% of charged-off loans. The field also does not track when a loan failed: across charged-off loans, its correlation with months to charge-off is -0.02.
| TermInMonths value | Loans | Charged off |
|---|---|---|
| Exactly 120 months | 82,560 | 0.37% |
| Any other standard value | 255,877 | 1.0% |
| Non-standard, 84 to 119 months | 18,419 | 28.4% |
| Any other non-standard value | 76,436 | 30.4% |
The pattern fits a field that is rewritten when a loan is modified or charged off. That is our inference; SBA’s data dictionary describes the field only as the length of the loan term. Used as a predictor, it leaks the outcome into the model and produces a large, false result that short terms are risky. We left it out.
Franchise brands and industries
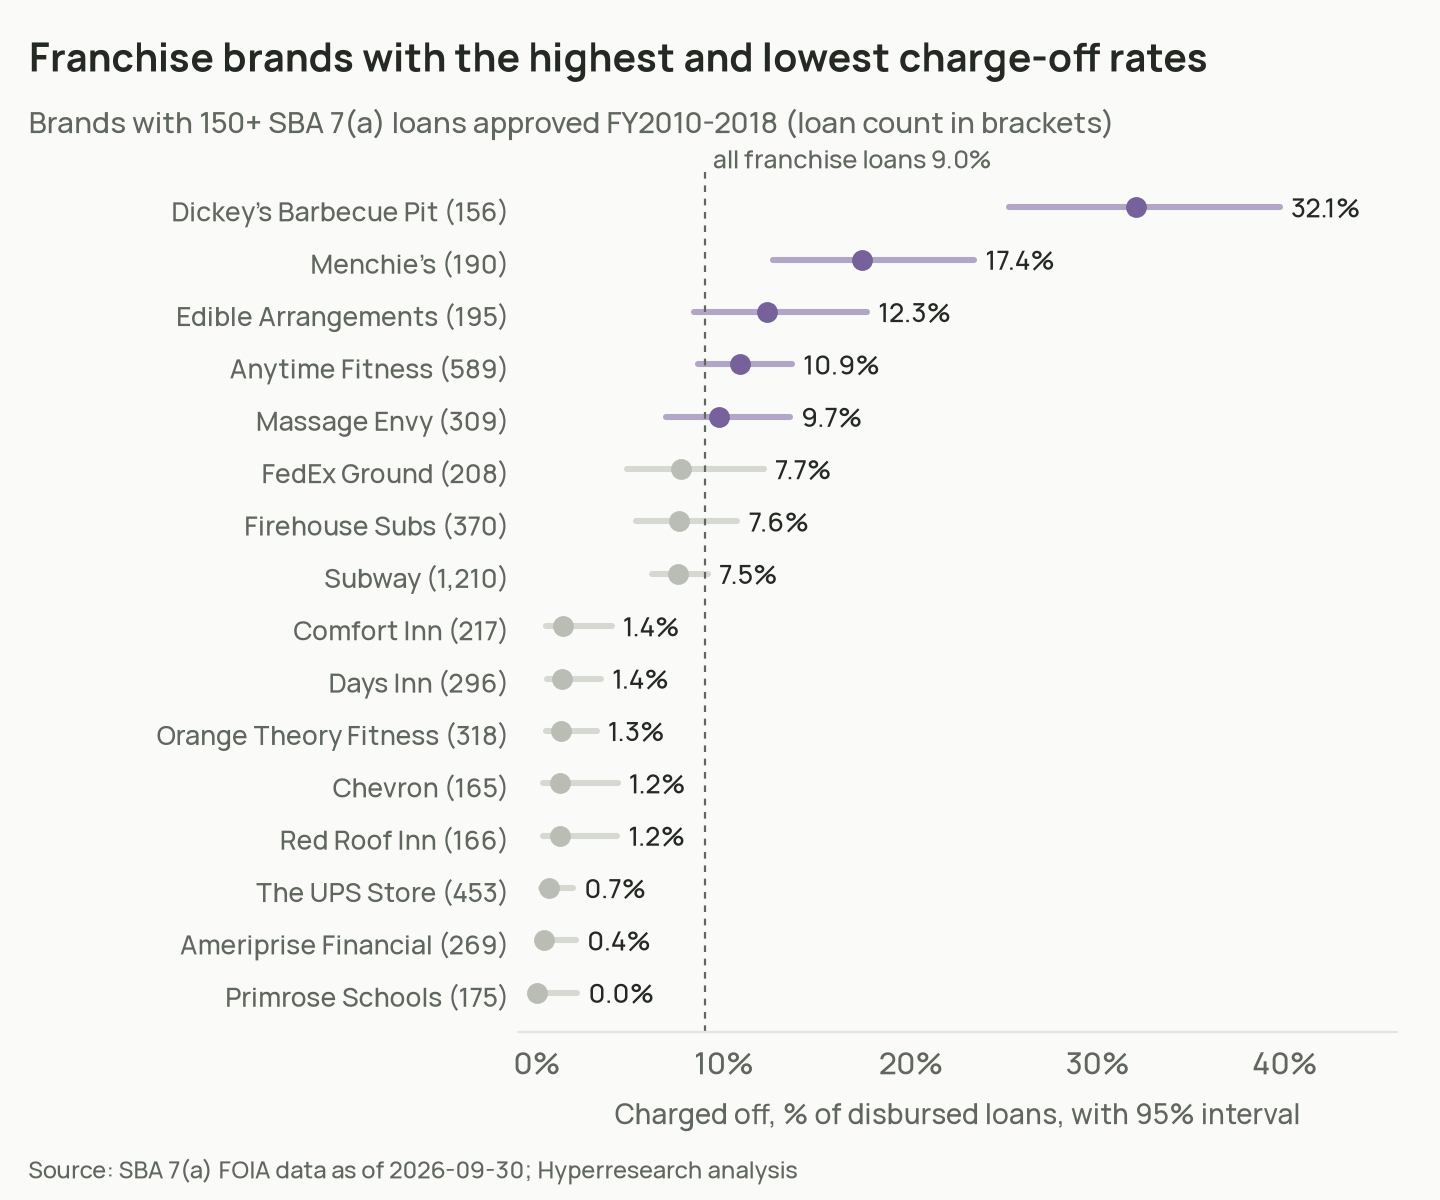
Brand results are supporting material and noisy. A brand with 150 loans and no charge-offs still has an upper 95% bound near 2.5%. SBA re-coded its franchise directory around FY2012-2013, so we grouped codes by normalized brand name. Of the 55 brands with 100 or more loans, these are the highest and lowest:
| Brand | Loans | Charged off | Rate | 95% interval |
|---|---|---|---|---|
| Dickey’s Barbecue Pit | 156 | 50 | 32.1% | 25.2% to 39.7% |
| Which Wich | 111 | 28 | 25.2% | 18.1% to 34.0% |
| Menchie’s | 190 | 33 | 17.4% | 12.6% to 23.4% |
| Edible Arrangements | 195 | 24 | 12.3% | 8.4% to 17.7% |
| Anytime Fitness | 589 | 64 | 10.9% | 8.6% to 13.6% |
| Subway | 1,210 | 91 | 7.5% | 6.2% to 9.1% |
| The UPS Store | 453 | 3 | 0.7% | 0.2% to 1.9% |
| Primrose Schools | 175 | 0 | 0.0% | 0.0% to 2.2% |
| Christian Brothers Automotive | 147 | 0 | 0.0% | 0.0% to 2.6% |
| Culver’s | 132 | 0 | 0.0% | 0.0% to 2.8% |
Industry sectors differ less than specific businesses do. Sectors with 1,000 or more loans range from 4.3% (finance and insurance) to 9.3% (arts, entertainment and recreation). Among the 262 six-digit industries with 300 or more loans, the spread is far wider:
| Industry (NAICS) | Loans | Charged off |
|---|---|---|
| Computer and office machine repair (811212) | 398 | 22.9% |
| Electronics stores (443142) | 593 | 18.0% |
| Limousine service (485320) | 612 | 15.8% |
| Residential remodelers (236118) | 5,611 | 11.6% |
| Fitness and recreational sports centers (713940) | 6,237 | 10.0% |
| Limited-service restaurants (722513) | 10,705 | 9.9% |
| Offices of dentists (621210) | 8,534 | 2.7% |
| Hotels and motels (721110) | 6,924 | 2.6% |
| Veterinary services (541940) | 3,701 | 2.2% |
| Self-storage lessors (531130) | 884 | 0.8% |
Method
- Source. SBA’s 7(a) loan-level FOIA files from data.sba.gov:
FOIA_7a_FY2000_FY2009_asof_260930.csv,FOIA_7a_FY2010_FY2019_asof_260930.csvandFOIA_7a_FY2020_Present_asof_260930.csv, data as of September 30, 2026. Industry titles come from the Census Bureau’s NAICS files. - Cohort. Disbursed 7(a) loans approved FY2010-2018: status paid in full, charged off, or active with status withheld. Cancelled and undisbursed loans are left out. FY2010 is the first year the interest-rate fields are complete. FY2018 is the last year that is close to fully seasoned: for 2000s loans, 87% of eventual charge-offs came within eight years, and FY2018 loans are about eight and a half years old. Later years also overlap COVID-era payment relief. 7.7% of the cohort is still active.
- Charged off. The loan status is CHGOFF: SBA wrote off the remaining balance after collection. That is a final loss, not a missed payment. A loan that defaulted and was later cured, or paid off by selling collateral, shows as paid in full.
- Rates. Charged-off loans divided by all disbursed loans in the group, with Wilson 95% intervals.
- Model. Logistic regression of charged off (yes or no) on log loan size, guaranteed share, initial interest rate, variable rate, franchise, revolving line, collateral, sold on the secondary market, business age, business type, lender type, processing method, Census region, and industry-sector and approval-year effects. Standard errors are clustered by lender. 433,263 loans with complete fields, 31,347 charge-offs. Pseudo-R² 0.046, AUC 0.67. We re-ran it on three other cohorts, without the rate terms, on ended loans only, without guarantee share and without the processing-method terms.
- Privacy. Borrower names and addresses were never read. Every output is an aggregate, and published groups have at least 50 loans.
Limits
- Associations, not causes. The model shows which loan features go together with charge-off. Rate, guarantee share, processing method and secondary-market sale are chosen by lenders based on what they know about the borrower.
- Brands. Brand rates rest on our grouping of SBA franchise codes by normalized name plus a short alias list. They mix years, places and lenders and may not describe a franchise system today. Brands with 100 to 200 loans have wide intervals.
- No de-duplication. Without borrower fields we cannot tell repeated rows from distinct loans with the same terms. 2,778 of the 1.64 million rows in the three files, under 0.2%, match another row on every field we keep.
- COVID relief. Payment relief for 7(a) borrowers in 2020 and 2021 likely delayed failures in recent cohorts. Whether it delayed or prevented them will not be clear for years.
- Loan term. The reading of TermInMonths as rewritten after modification or charge-off is ours, and SBA has not confirmed it.
- Self-reported fields. Lenders enter industry, business age and franchise codes, and SBA does not audit them. Lender type is inferred from the current lender of record.
Download the data
- Charge-off rate by approval year, with three- and five-year rates
- By initial interest rate and by rate relative to the year’s median
- Main model coefficients and robustness versions
- Express check and guarantee share by processing method
- Non-bank check and loan terms by lender type
- Loan-term field by value and by loan status
- Franchise brands, 100+ loans, six-digit industries, 300+ loans and sectors
- Lender type, processing method, method by loan size, loan size, state, business age and time to charge-off
Hyperresearch made this study by writing and running the analysis scripts on the public SBA file and re-deriving each published figure from the tables above before publishing.