
Guides
What sets a consultant's hourly rate: a study of 333,289 GSA contract rates
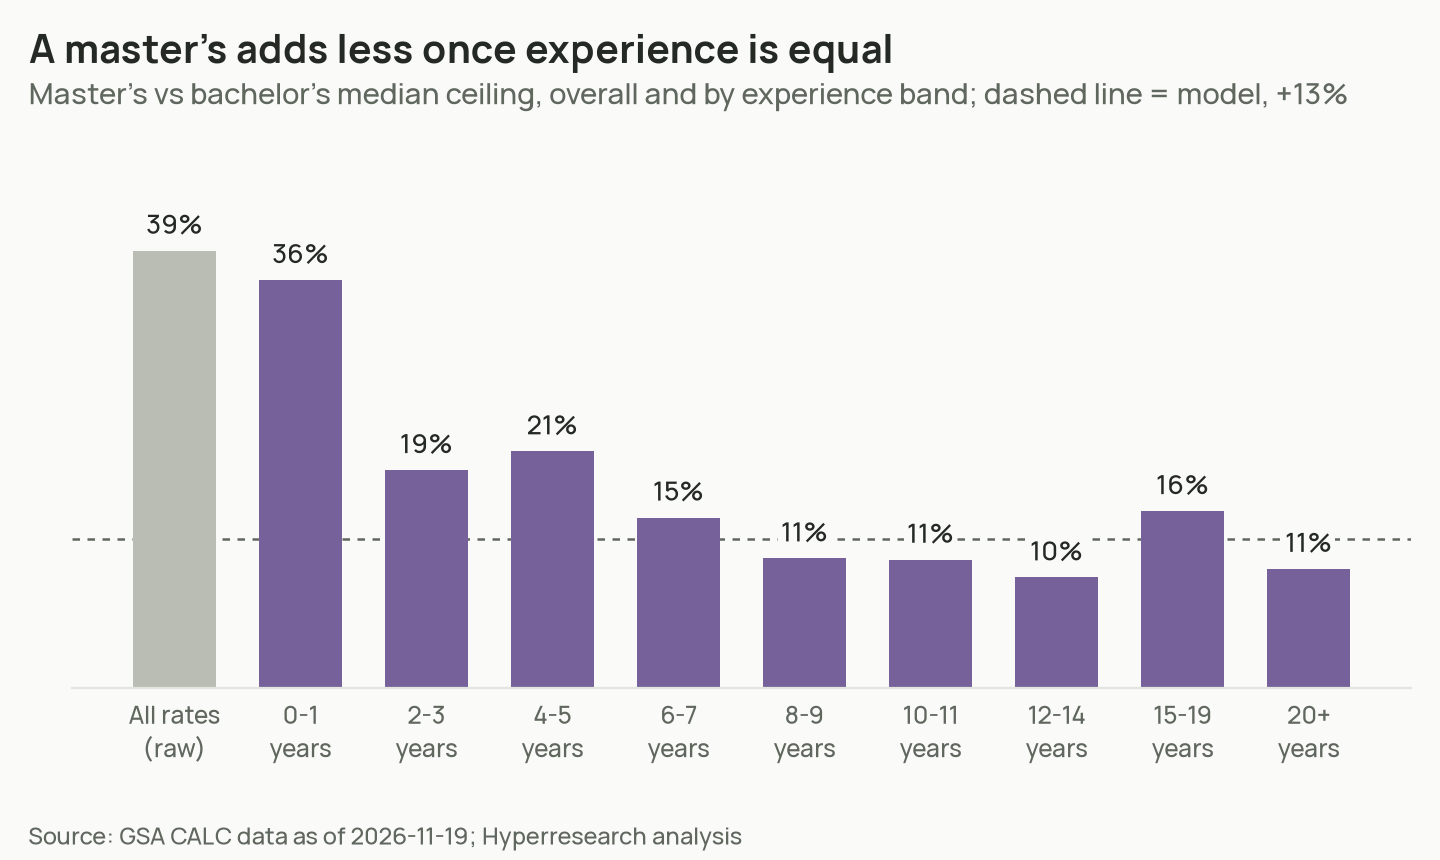
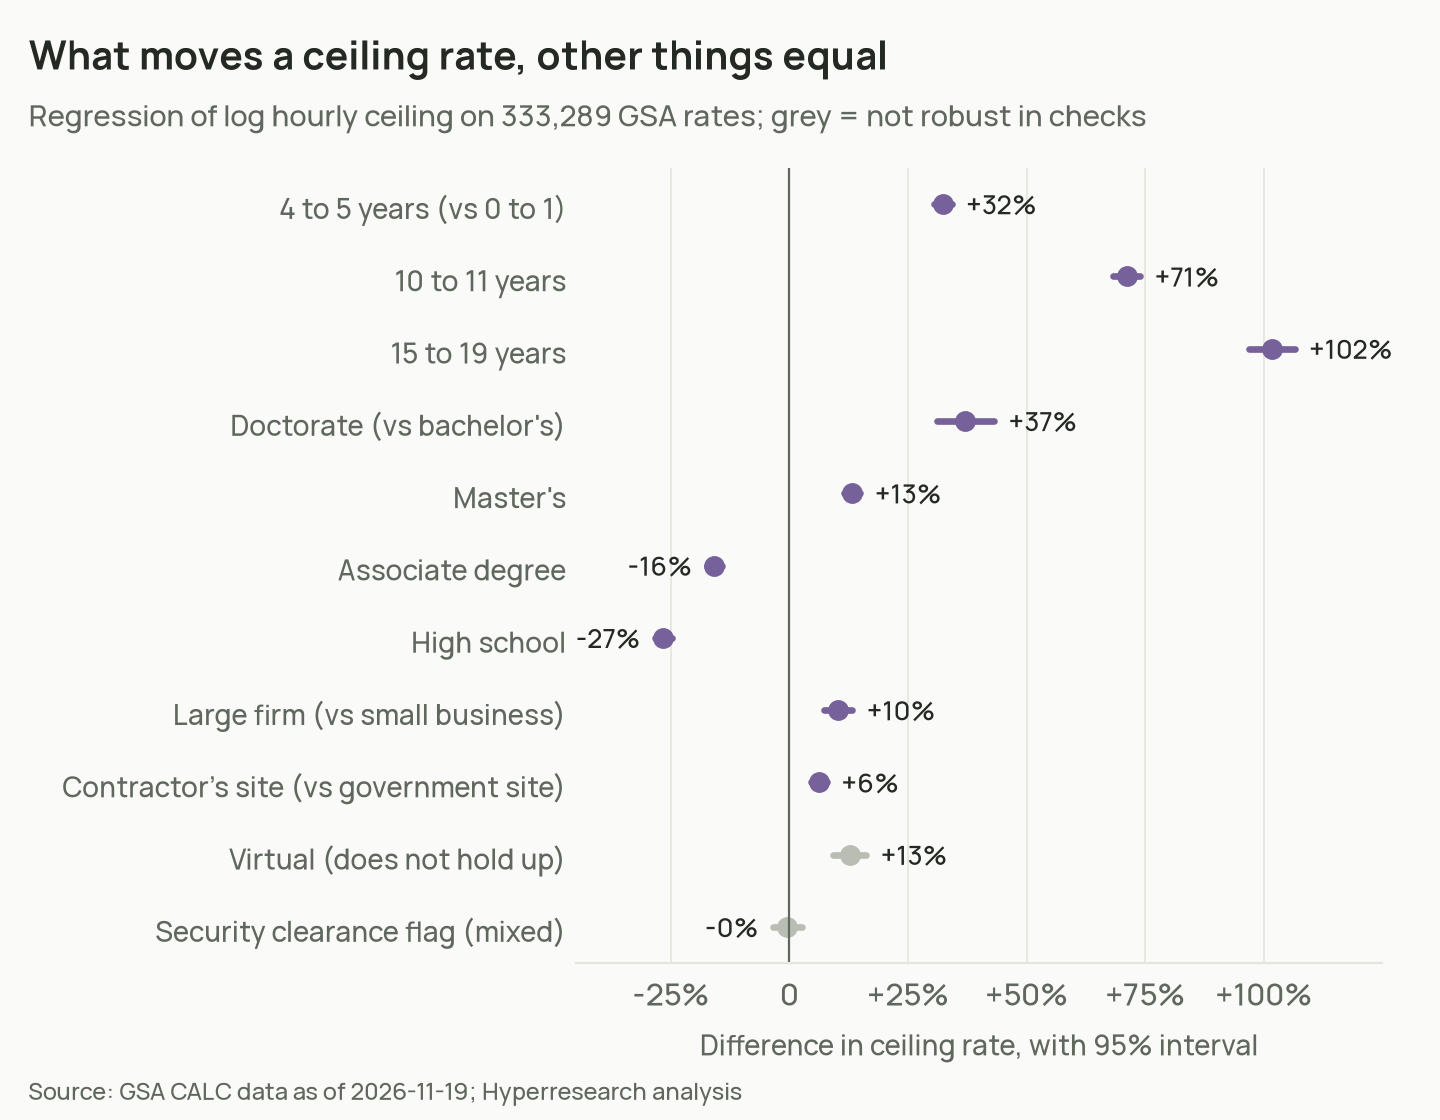
Across 333,289 hourly ceiling rates on federal GSA contracts, the experience a labor category requires is the biggest single factor in the price. Each extra year of required experience adds about 4.8% to the hourly ceiling when education, job family, firm size, worksite and contract are held equal. A rate that asks for 15 to 19 years is about twice one that asks for 0 to 1. A master’s degree adds 13% over a bachelor’s at the same experience, a third of the 39% gap in the raw medians. Large firms list ceilings about 10% above small businesses for the same job description, and work at the contractor’s own site is priced about 6% above work at the government’s site. Consulting rates have a median of $132.52 an hour, and the firm that holds the contract matters about as much as any of these features.
Main results
- Experience. Median consulting ceilings run from $82.10 an hour at 0 to 1 years to $213.98 at 15 to 19 years and $242.33 at 20 or more. After controls, 15 to 19 years is 101.7% above 0 to 1 years (95% interval 97.0% to 106.5%).
- Education. A master’s adds 13.2% (11.4% to 15.0%) and a doctorate 37.0% (31.1% to 43.1%) over a bachelor’s. A high school minimum is 26.6% lower.
- Firm size. Firms the schedule classes as other than small list ceilings 10.2% higher (7.2% to 13.2%).
- Worksite. Work at the contractor’s site is 6.2% higher (4.6% to 7.9%). In about half of the cases where one contract prices the same job at both sites, the price is the same.
- Job family. Management consulting and strategy titles sit 23.3% above business analyst titles with the same requirements.
- The firm. The same job description is priced about 1.7 times as high at a high-priced firm (90th percentile) as at a low-priced one (10th percentile).
- What did not hold up. A 13% premium for virtual work disappears inside each firm. A security clearance flag shows no premium across firms and a modest one inside them.
What these rates are
Every rate in this study is a ceiling price. It is the most a company holding a GSA Multiple Award Schedule contract may charge a federal agency for one hour of a labor category in the current contract year. Agencies can ask for lower prices on each order, and what they actually paid is not in the file. The rates are fully loaded billing prices that cover salary, benefits, overhead and profit. They are not pay. Employed management analysts earned a median $48.97 an hour in May 2025 according to the Bureau of Labor Statistics, or $50.70 in consulting firms, so the consulting ceiling median is about 2.7 times the wage. Private clients are not bound by any of these prices.
The file is still the largest public record of how firms price professional labor. Each rate states a job title, a minimum education, a minimum number of years of experience, a worksite, the firm’s business size and whether a security clearance applies. That makes it possible to separate these features in a way that surveys of consultants cannot.
Experience drives the price more than anything else
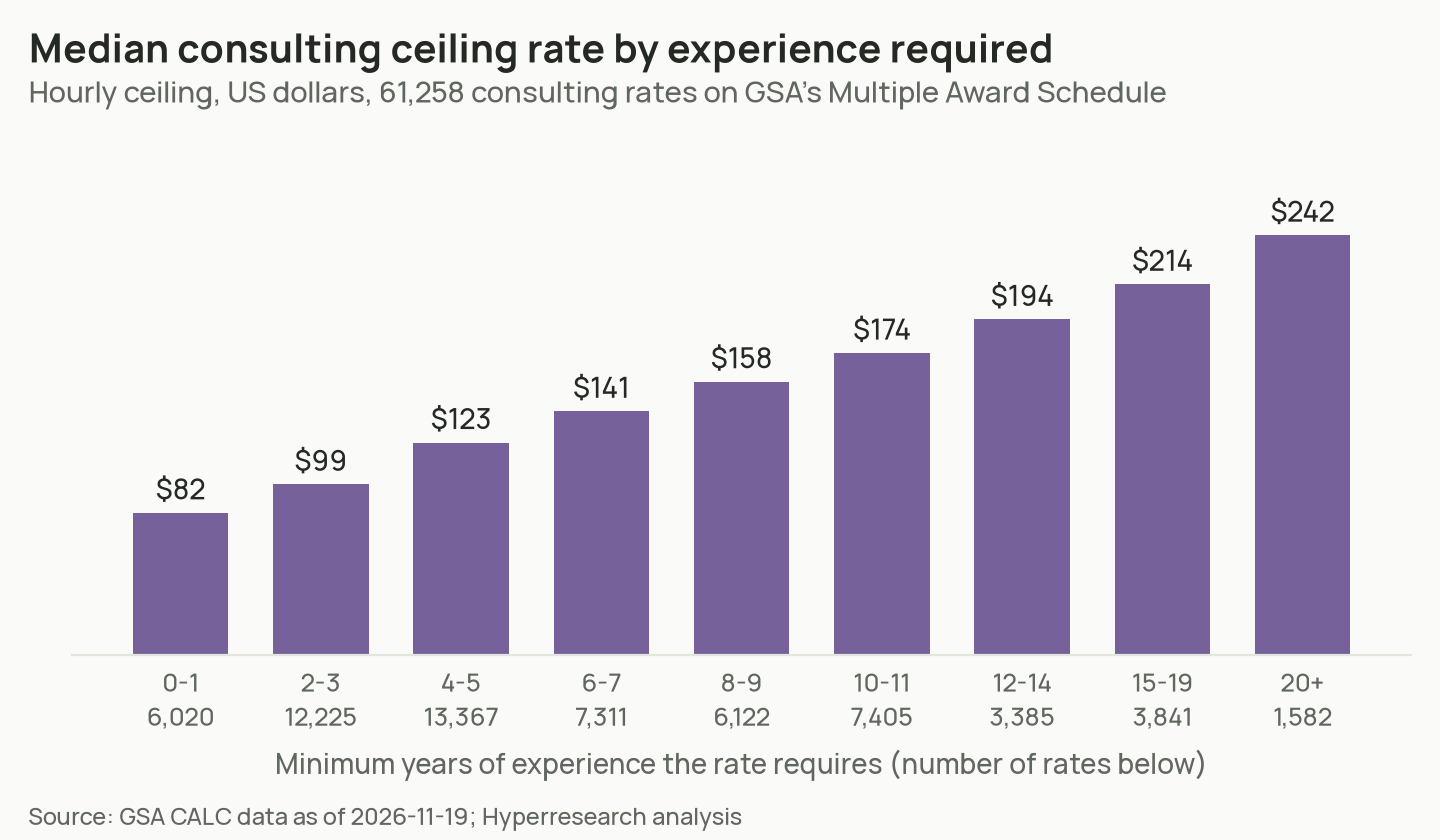
| Minimum experience | Consulting rates | 25th percentile | Median | 75th percentile |
|---|---|---|---|---|
| 0 to 1 years | 6,020 | $63.81 | $82.10 | $103.16 |
| 2 to 3 years | 12,225 | $77.65 | $98.56 | $122.98 |
| 4 to 5 years | 13,367 | $97.00 | $122.67 | $152.23 |
| 6 to 7 years | 7,311 | $113.07 | $140.70 | $172.09 |
| 8 to 9 years | 6,122 | $128.08 | $157.75 | $193.25 |
| 10 to 11 years | 7,405 | $138.90 | $174.28 | $216.72 |
| 12 to 14 years | 3,385 | $156.36 | $193.73 | $243.00 |
| 15 to 19 years | 3,841 | $170.21 | $213.98 | $272.25 |
| 20 or more years | 1,582 | $191.05 | $242.33 | $309.06 |
On its own, the experience requirement explains 34% of the variation in the log of the rate across the whole file. Education explains 26% on its own and job family 23%. Firm size explains under 1% and worksite under 2%, even though both have real effects once the larger factors are held fixed.
The raw climb overstates experience a little, because senior rates also tend to ask for more education and carry senior job titles. Holding those fixed, each year adds 4.8% (4.7% to 5.0%), or 5.5% for rates that require up to 15 years. Measured within each firm, the effect is larger: 15 to 19 years comes out 114.6% above 0 to 1 years.
The seniority word in the title carries some of the same information. Adding it to the model trims the 15 to 19 year effect from 101.7% to 84.4%. Titles with words such as principal, director or expert are 14.2% above titles with no level word at the same experience, and titles with junior, associate or a roman numeral I are 5.2% below.
A master’s degree adds 13% once experience is equal
The raw medians suggest a large reward for a degree. Bachelor’s rates have a median of $135.22 and master’s rates $187.53, a gap of 38.7%. Most of that gap is experience. Labor categories that ask for a master’s require a median of 10 years’ experience, against 5 for a bachelor’s.
| Education minimum (vs bachelor’s) | Rates | Raw median | Difference after controls | 95% interval |
|---|---|---|---|---|
| High school | 38,524 | $69.04 | -26.6% | -28.4% to -24.7% |
| Associate degree | 20,901 | $90.39 | -15.9% | -17.5% to -14.3% |
| Bachelor’s degree | 248,355 | $135.22 | reference | |
| Master’s degree | 19,700 | $187.53 | +13.2% | +11.4% to +15.0% |
| Doctorate | 1,975 | $222.48 | +37.0% | +31.1% to +43.1% |
Inside each experience band, the master’s median is 10% to 21% above the bachelor’s median from two years up. If experience is left out of the model, the master’s premium jumps to 32.4% and the doctorate premium to 57.8%. That is the size of the mistake a raw comparison makes.
We also checked that the education field is not a default that some firms apply to every rate. Within contracts that list two or more education levels, comparing rates inside the same firm, a master’s still adds 13.3% (12.0% to 14.5%) and a doctorate 35.1%.
Large firms list rates about 10% higher
Firms the schedule classes as other than small have a median ceiling of $135.85 an hour, against $124.97 for small businesses. After controls the gap is 10.2% (7.2% to 13.2%). It holds when job family, contract type, contract start year or worksite is dropped from the model, with estimates from 9.9% to 11.5%. In 160 groups of the same job family and experience band with at least 30 rates of each size, larger firms have the higher median in 96.2% of them. The median gap across those groups is 11.5%.
For consulting rates alone the gap is smaller, 7.0% (3.7% to 10.4%). For contracts awarded in 2024 to 2026 it is larger, 15.9% (8.0% to 24.4%).
The file cannot say whether size itself raises the price. Only 10 of the 6,783 contract holders list rates under both sizes, so the comparison is between different firms. Larger firms may carry more overhead or a stronger brand, and either would show up here as a size effect.
Work at the contractor’s site costs about 6% more
Rates for work at the contractor’s own facility are 6.2% above rates for work at the government’s site (4.6% to 7.9%), and 7.1% higher when comparing rates inside the same firm. The check that matters most is a direct one. On 1,095 contracts, the same job with the same education and experience is priced at both sites, which gives 51,785 pairs. In 45.5% of the pairs the two prices are identical. The contractor’s site is higher in 53.9% and lower in 0.6%, and the median gap across all pairs is 3.7%. A firm that hosts the work pays for the space, and many build that into the rate.
Job family and the firm both matter
| Job family (from title) | Rates | Median | Difference after controls, vs business analysts |
|---|---|---|---|
| Subject matter expert | 11,003 | $197.46 | +31.4% |
| Executive and principal | 9,950 | $170.97 | +23.3% |
| Management consulting and strategy | 13,994 | $157.84 | +23.3% |
| Program and project management | 29,974 | $158.20 | +17.6% |
| Cybersecurity | 20,560 | $144.69 | +14.2% |
| Data and analytics | 16,498 | $134.20 | +9.5% |
| Business and functional analysis | 16,462 | $115.31 | reference |
| Help desk and IT support | 5,413 | $80.27 | -17.1% |
| Admin and clerical | 8,588 | $55.60 | -25.3% |
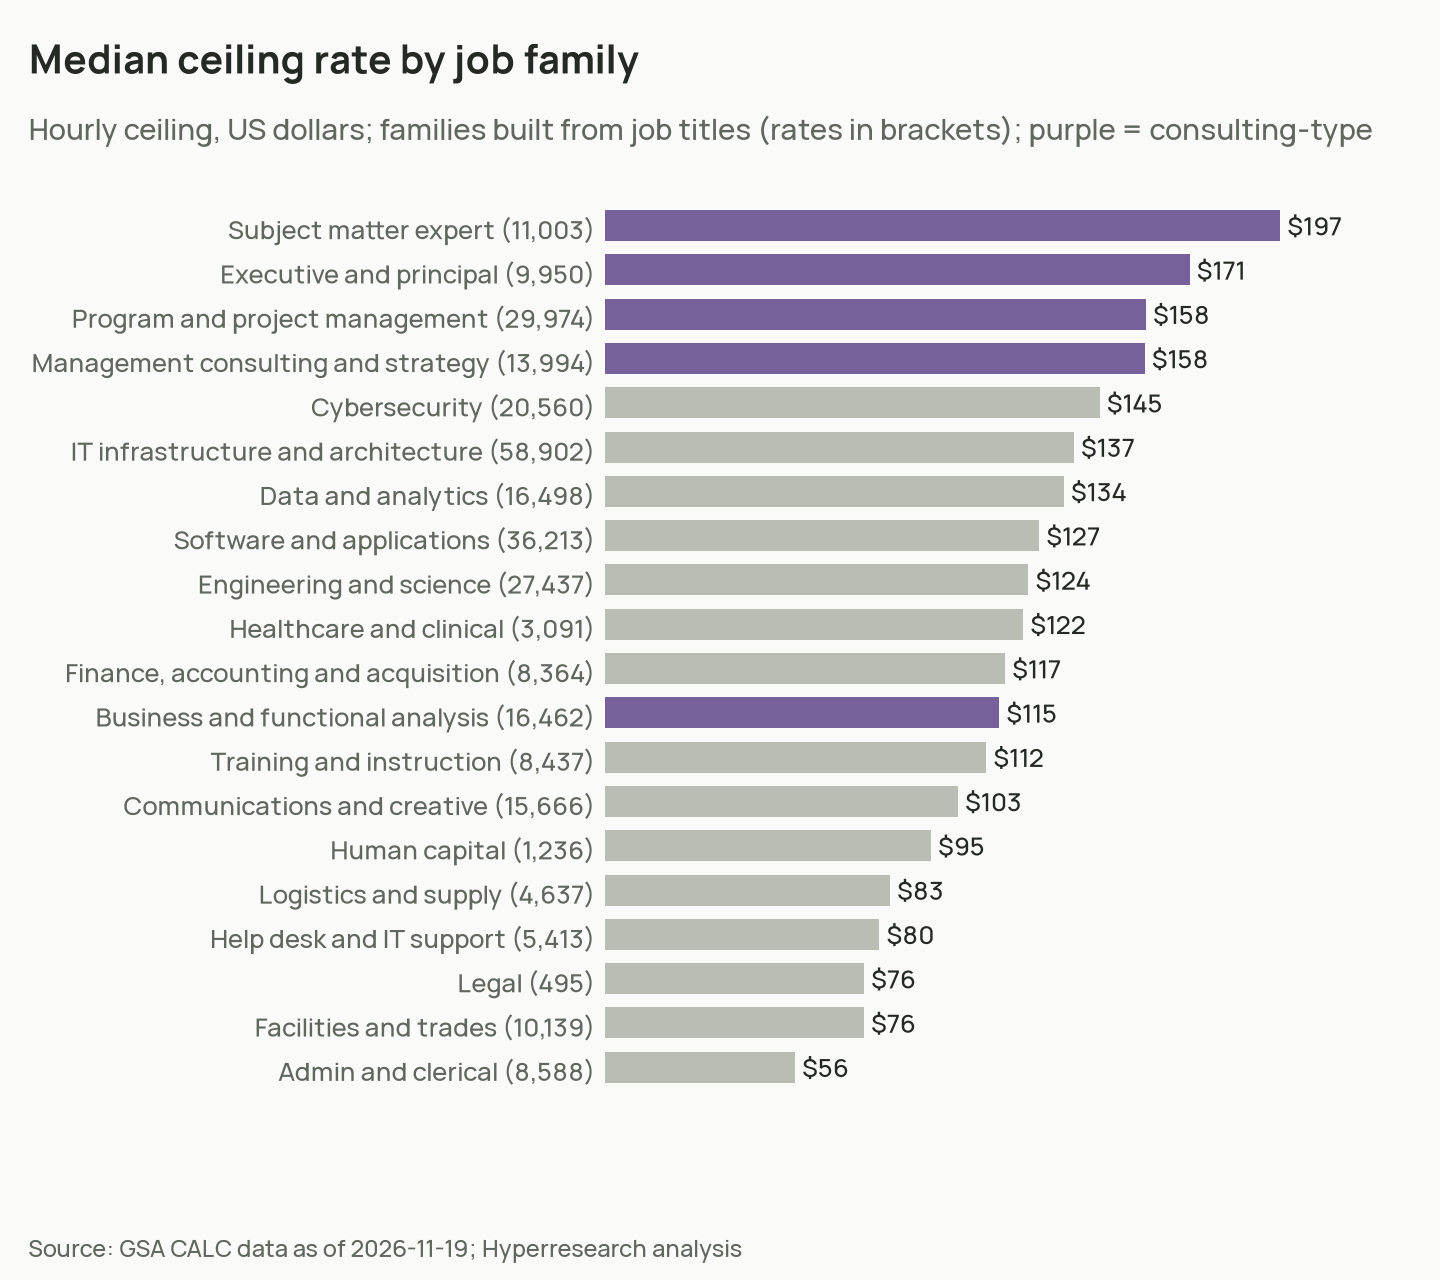
The families are built from the words in each job title, and the full rule is in the method. The adjusted gaps are smaller than the raw ones because consulting and management titles also tend to ask for more experience and education.
Everything the file states about a rate explains 54% of the variation in its log. The identity of the firm alone explains 39%, and the two together explain 74%. Among the 3,839 firms with 20 or more rates, the firm at the 90th percentile prices the same job description 31.2% above the average, and the firm at the 10th percentile 23.1% below it. Between those two firms, the same job on paper differs by a factor of about 1.7. Some of that is work the fields do not describe, and some is pricing strategy.
Two effects that did not hold up
| Feature | Across all rates | Inside the same firm | Same contract and job, priced both ways |
|---|---|---|---|
| Virtual work vs government site | +12.7% | -1.5% (-7.4% to +4.8%) | 93.1% of 814 pairs identical |
| Security clearance flag | -0.5% (-3.5% to +2.6%) | +6.5% (+3.1% to +10.1%) | median +10.0%, 713 pairs on 25 contracts |
Virtual work looks 12.7% more expensive across the file, and its raw median is $146.19 against $121.04 at the government’s site. Inside each firm the gap is gone, and where one contract prices the same job both ways, the price is the same in 93.1% of the pairs. The premium comes from which firms offer virtual rates, not from the worksite.
The security clearance flag shows no premium across firms. Firms that flag cleared rates are not more expensive overall, but inside a firm the cleared version of a job costs about 6.5% more. The flag covers 6.3% of rates, does not say which clearance, and the direct pairs rest on only 25 contracts.
Rates rise about 2.75% a year
Almost every rate lists next year’s ceiling as well. The median step to next year is 2.75%. 83.7% of rates rise and 14.0% stay flat. Contracts awarded since 2024 step up faster, with a median of 3.2% to 3.3%, against 1.9% to 2.5% for contracts awarded from 2008 to 2021. The year a contract was first awarded barely affects today’s price: every award year from 2007 to 2025 sits within a few percent of 2019 after controls, and only 2026 awards are clearly higher, by 6.9%.
Method
- Source. GSA’s CALC+ labor ceiling rates through its public API at api.gsa.gov/acquisition/calc/v3/api/ceilingrates/ (documentation), index of November 19, 2026. No key was needed. The search window stops at 10,000 rows, so we pulled the file in slices by experience, business size and price and checked the total against the API’s own count: 357,429 of 357,431 rows. Every rate is on the Multiple Award Schedule, across 153 special item numbers (SINs) and contracts first awarded from 2007 to 2026.
- One rate per row. The API repeats a rate once for each SIN it is offered under. We count one rate per contract, title, education, experience, worksite, business size, clearance flag and price: 333,289 rates on 6,915 contracts held by 6,783 firms. Future option years appear as extra price columns, not extra rows, and we use the current-year price throughout.
- Consulting rates. Rates offered under SIN 541611, GSA’s category for management and financial consulting and program and project management services, leaving out admin and clerical, facilities and trades, logistics and help desk titles. That keeps 61,258 of 65,917 rates on 2,445 contracts. Titles containing “consultant” alone give a higher median, $163.21 across 15,496 rates.
- Job families. 20 families plus “other”, assigned by the first matching set of words in the title, so “IT project manager” counts as project management. 7.9% of rates fall in “other”. The mapping for every title with 10 or more rates is published below.
- Model. Ordinary least squares of the log hourly ceiling on experience band, education, business size, worksite, clearance flag, job family, the rate’s main SIN and the year the contract was first awarded. Percent effects are exp(coefficient) - 1. Standard errors are clustered by firm. R² 0.537 across 333,289 rates.
- Robustness. We re-ran the model with firm fixed effects, on consulting rates only, on consulting rates with firm fixed effects, without rates below the 1st or above the 99th percentile ($35.64 and $353.74), on contracts awarded in 2024 to 2026, on management consulting titles only, on every API row without de-duplication, and with one rate per contract and title. Experience, education and contractor site hold in every version. Firm size holds in every version without firm fixed effects; with them it cannot be measured, because almost no firm lists rates under both sizes.
- Overlap between features. For each headline effect we dropped the feature it overlaps with most and compared the result with a plain cross-tab before reporting it. That check turned a 39% raw master’s premium into 13%, and it removed the virtual-work premium.
Limits
- Ceilings, not prices paid. Agencies negotiate discounts on orders. The file does not say what any agency paid or how many hours it bought.
- Federal work only. Firms that hold a GSA schedule lean toward government work, and commercial prices for the same firms are not visible here.
- Firms write their own fields. Titles, experience minimums and education minimums are set by each firm, so “Senior Consultant” means different work at different firms. Many contracts set one worksite for every rate.
- Our classification. Job families and title seniority words come from our own rules on the title text.
- Associations. The model shows how listed features go with price. It does not show that adding a degree would raise a given person’s rate.
- The index changes nightly. These figures are for November 19, 2026.
Download the data
- Distribution of all and consulting rates
- By experience, by education, by business size, by worksite and by clearance flag
- By job family and title-to-family mapping, titles with 10+ rates
- Main model coefficients, robustness versions and variation explained by each field
- Master’s vs bachelor’s by experience, same-contract pairs and spread of firm effects
- Next-year price steps by award year and missing data by field
Hyperresearch made this study by writing and running the analysis scripts on GSA’s public file and re-deriving each published figure from the tables above before publishing.